These panels are becoming
more and more popular in Alsager.
The question is - Do they deliver?
This article is a detailed
case study of a real Alsager installation over a period of one year together
with cost benefit analysis.
System parameters:
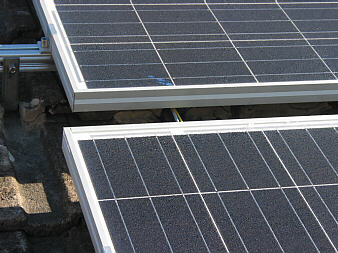
16 panels - 4KW nominal (Canadian Solar amorphous silicon )
Invertor - Stecagrid 3600
Aspect - South West
Roof inclination 30 deg,
Site specifics - Minor shading from trees in north west.
Total installation cost - £6,400
Production data:
The invertor has the ability to connect to a PC to download daily performance
figures.
These have been consolidated into a spreadsheet SOLAR.XLS
which contains charts showing typical day curves and daily / weekly /
monthly bar graphs.
The spreadsheet includes all the raw data so that other analysis charts
can be produced.
Basic panel economics:
Most people dont know
that there are two separate tariffs for solar panels.
There is the 'Feed In' production tariff (FIT) which applies to every
KWH generated regardless of whether it is exported or not.
Also there is the 'Export' tariff for every KWH exported to the grid.
The tariffs are paid by the electricity companies and costs are passed
on to consumers in higher prices.
The payments go up every year in line with RPI.
The tariff rates for a particular installation are fixed by OFGEM depending
on the date when the system is installed and are valid for 20 years.
The rates offered to new installations are specified by OFGEM on a yearly
basis to control the take up necessary to achieve government targets for
solar panels.
So the rates will tend to reduce as the total number of installations
approaches the target.
For this case study
Production (FIT) tariff = 16.5p / KWH
Export tariff = 4.64p / KWH
Most installations do not have an export meter and the company assumes
that 50% of the production is exported when calculating the payments.
This creates an incentive to use all the electricity produced especially
in summer because the exports have zero effect on the income.
The income is 16.5 + (4.64 * 0.5) = 18.82p / KWH produced
Financial data:
The spreadsheet Panels_ISA_Comparison
shows the financial performance compared with the investment of the same
capital in an ISA. The figures in blue can be altered as necessary.
It seems to show that the panels would be equivalent to an ISA offering
an interest rate of 7.5%.
Some companies will install the panels free in return for the payments
from the production tariff.
Usually they will only consider south facing roofs. Also you might have
to pay compensation for their lost income if you need to have some work
done on the roof. The spreadsheet includes some figures
for a 'free panel' installation.
There are some other factors which have not been taken into account in
these financial performance figures..
1) Its unlikely that
the invertor will last for 20 years without repair or replacement.
2) The efficiency of
the panels gradually declines.
3) The figures for 'saved electricity' can vary quite a lot because each
household has a different energy consumption profile.
Energy management:
(This section will be added in Part 2)
Contact Us:
Comments / Questions can be sent to Boxnum
3000
If you have an installation in Alsager and would like to share information
please specify if you would like to go onto a mailing list.